Your Images Are Probably the Slowest Thing on Your Website
Summary
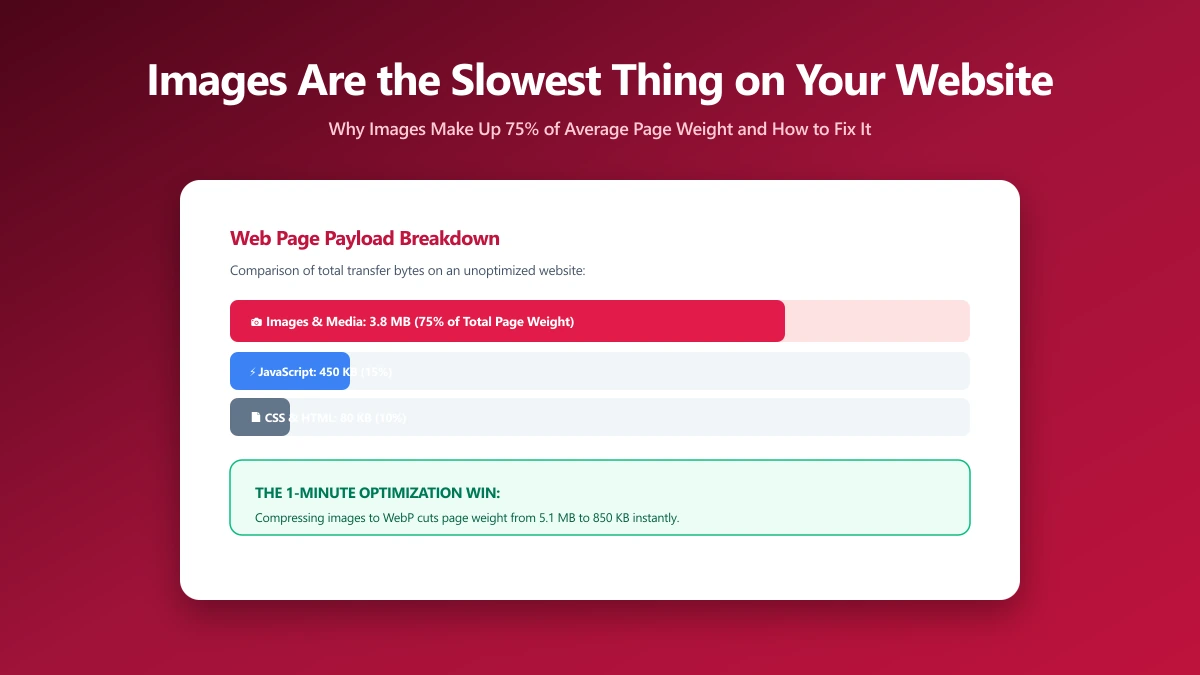
Developers check JS first when pages are slow. Images are almost always the real bottleneck. Five DevTools steps identify exactly which images to fix.
When a page feels slow, the instinct is to look at JavaScript. Check the bundle size, split code, defer a script. It's where developers are most comfortable and where performance advice is most abundant. But on the majority of real websites, the bottleneck isn't code at all.
A homepage that takes over four seconds to load frequently has perfectly fine HTML, CSS, and JavaScript, the problem is a hero image at 3 MB, a product grid with twelve 800 KB PNGs, and a background texture served as an unoptimised 1920px JPEG. HTTP Archive data consistently shows images account for over 75% of total page weight. Optimising your images is the single most impactful thing you can do for most websites.
This guide walks through the exact DevTools steps to confirm images are your bottleneck, the three most common causes, and the correct order to fix them.
Step 1: Confirm Images Are the Bottleneck
Open Chrome DevTools → Network tab → reload the page with the cache disabled (Ctrl+Shift+R / Cmd+Shift+R). Sort by the "Size" column descending. If the top five entries are images, you've confirmed the problem. Also check the "Waterfall" column, images that start loading late or overlap with critical resources are structural issues beyond just file size.
// Run in the browser console after page load.
// Lists all image resources sorted by transfer size.
performance.getEntriesByType('resource')
  .filter(e =>
    e.initiatorType === 'img' ||
    e.name.match(/\.(jpg|jpeg|png|webp|avif|gif|svg)/i)
  )
  .sort((a, b) => b.transferSize - a.transferSize)
  .slice(0, 10)
  .forEach(e => {
    const kb = Math.round(e.transferSize / 1024);
    const ms = Math.round(e.duration);
    const name = e.name.split('/').pop().split('?')[0];
    console.log(\`\${kb} KB  \${ms}ms  \${name}\`);
});Run PageSpeed Insights on your homepage URL before manually hunting for problems. The "Opportunities" section identifies specific images by filename with exact potential savings. It will tell you exactly what to fix first.
The Three Most Common Image Performance Problems
1. Oversized Source Images
A 4000×3000px image displayed at 400×300px wastes 100× the decoded memory and roughly 10× the transfer bandwidth. The browser downloads the full-resolution source regardless of how small the CSS renders it, there is no automatic resize. This is the most common and most impactful problem on image-heavy pages.
Fix: Resize images to the largest size they will ever be displayed at, plus 2× for retina screens. A 400px column image needs a 800px source maximum.
2. Wrong Format for Content Type
PNG for photographs is typically 3–5× larger than equivalent-quality JPEG, and 4–7× larger than WebP at similar quality. PNG is the correct choice for screenshots, logos with transparency, and pixel art. For photos and anything without transparency, JPEG at quality 80 or WebP at quality 75 saves the majority of those bytes.
| Image type | Best format | Avoid | Why |
|---|---|---|---|
| Photos, product shots | WebP q75 or JPEG q80 | PNG | PNG for photos is 4–7× larger with no quality benefit |
| Screenshots, UI diagrams | PNG | JPEG | JPEG creates artifacts on flat colors and sharp edges |
| Logos with transparency | PNG or SVG | JPEG | JPEG does not support transparency |
| Icons, illustrations | SVG | PNG/JPEG | SVG scales infinitely; no rasterisation required |
| Animated content | WebP or video | GIF | GIF has 256 colors; WebP animation is 3–4× smaller |
3. No Lazy Loading Below the Fold
Without lazy loading, every image on the page, including those eight scrolls down, is downloaded on initial page load, competing with resources the user needs immediately. Adding loading="lazy" to all below-fold images defers their download until the user scrolls toward them, dramatically improving Time to Interactive on long pages.
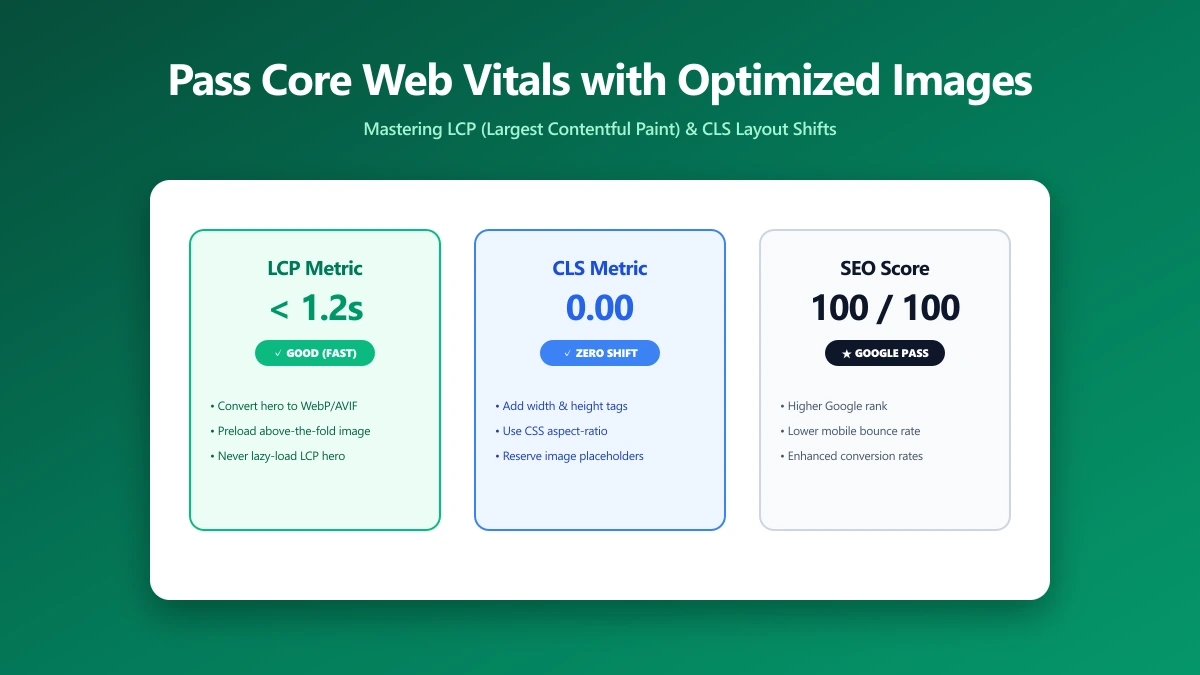
Critical exception: Never add loading="lazy" to the LCP image (the hero or first visible image). Lazy-loading the LCP candidate is one of the most common ways to accidentally destroy your Core Web Vitals score. Add fetchpriority="high" to the LCP image instead.
The Correct Optimisation Order
Apply these steps in order, each one builds on the previous:
- 1.Right-size first: Resize images to display dimensions. This has the largest impact on transfer size. A 4000px image resized to 800px saves 75–90% of bytes before any compression is applied.
- 2.Right-format second: Switch photographs from PNG to WebP or JPEG. Correct format selection saves 50–80% on photos incorrectly saved as PNG.
- 3.Compress third: Apply lossy compression at quality 75–80 for photos. At this quality level, file size drops 40–60% with no perceptible quality loss at screen resolution.
- 4.Lazy load fourth: Add
loading="lazy"to all images not visible in the initial viewport. This reduces initial page weight and improves Time to Interactive. - 5.Prioritise LCP last: Add
fetchpriority="high"to the LCP image and remove anyloading="lazy"from it.
Measuring the Impact
After making changes, measure with PageSpeed Insights using your real URL. This uses Chrome User Experience Report data (real-user measurements), not just lab simulation. Focus on the "Largest Contentful Paint" metric first, image optimisation typically improves LCP by 0.5–2 seconds and moves the Performance score by 10–25 points on image-heavy pages.
Quick Five-Minute Audit for Any Website
- ●PageSpeed Insights → check "Opportunities" section for image-specific items, it names exact files and estimated savings
- ●DevTools → Network tab → sort by Size → identify all images over 200 KB, those are your priority targets
- ●LCP check: In DevTools → Performance tab → record a page load → find the LCP entry in the timings row. Is it an image? Is that image lazy-loaded? Does it have
fetchpriority="high"? - ●Format check: In the Network tab, filter by "Img" type and look at the "Type" column. Any "png" entry for a photograph-style image is worth converting.
- ●Run the console snippet above to get a ranked list of image resources by transfer size, attack the top five first.
The Bottom Line
Start with the five largest images on your heaviest page. Compress and right-size those five, re-run PageSpeed Insights, and measure how much the LCP score moves. In most cases, addressing the top five images moves the Performance score more than any JavaScript optimisation could. Compress your images here, no upload, no account, results in seconds.
Frequently asked questions
Why does JavaScript get blamed for slow pages when images are usually the cause?
How do I find the LCP element on my page?
What is a good page weight target for images?
Does image compression affect image quality visibly?
Sources & references
This article was researched and written by Nikola, drawing on the following primary sources and documentation:
Ready to try it?
All tools run entirely in your browser, no uploads, no account required.
Compress Image