What the JPEG Quality Slider Actually Does (It's Not What You Think)
Summary
Quality 80 is not "80% of the original". It's a quantisation table scalar. Here's how the DCT-based encoding actually works and what settings to use.
Most people using image compressors think quality 80 means "80% of the original detail preserved." It's an intuitive interpretation, but it's wrong, and the misunderstanding leads to two common mistakes: using quality 95 thinking it's dramatically better than 85 (it isn't), and being surprised that quality 80 on one image produces a 200 KB file while quality 80 on another produces a 2 MB file.
The quality number is not a percentage of fidelity. It's a scalar that adjusts a quantisation table, a matrix of divisors applied to frequency components after a mathematical transform. Understanding the actual mechanics changes how you choose quality settings and helps you predict what will happen to specific types of images.
What Actually Happens Inside the JPEG Encoder
JPEG compression is a five-step pipeline, and data loss only happens in step four:
- 1.Colour space conversion: RGB is converted to YCbCr, separating brightness (Y) from colour information (Cb, Cr). Human eyes are more sensitive to brightness detail than colour detail.
- 2.Chroma subsampling: The colour channels (Cb, Cr) are downsampled to half resolution (4:2:0), halving their data. Invisible for photographs; visible for images with sharp colour boundaries.
- 3.Block splitting: The image is divided into 8×8 pixel tiles. Each channel is processed independently per block.
- 4.DCT (Discrete Cosine Transform): Each 8×8 block is transformed into 64 frequency coefficients, one DC (average brightness) and 63 AC (frequency detail) values.
- 5.Quantisation, where data is permanently lost: Each coefficient is divided by a value from the quantisation table and rounded. This is irreversible. The quality slider controls this table.
- 6.Entropy coding: The quantised coefficients are Huffman-coded for further lossless compression. This step loses no additional data.
The Quality Number Scales the Quantisation Table
The quality value (1–100) does not directly measure how much of the image is preserved. It scales the quantisation table, a 8×8 matrix of divisors. Higher quality settings use smaller divisors (less quantisation, less data loss, larger files). Lower quality settings use larger divisors (more quantisation, more data loss, smaller files).
At quality 100: divisors approach 1, almost no quantisation, very little loss, very large files. At quality 50: the standard JPEG divisors (libjpeg baseline). At quality 1: divisors are roughly 100× the baseline, extreme loss, tiny files.
Quality 80 in Photoshop, quality 80 in libjpeg, quality 80 in ImageMagick, and quality 80 in the browser Canvas API all produce different file sizes and artifact profiles. They each use different quantisation tables. "Quality 80" is not a universal standard, it's encoder-specific. This is why the same quality setting produces different results in different tools.
Non-Uniform Quantisation: Why Detail Suffers More Than Tone
The 64 positions in the quantisation table apply different divisors to different frequency components. Low-frequency coefficients (broad tones, gradual gradients) get small divisors, they're preserved almost exactly at any quality above 50. High-frequency coefficients (fine texture, sharp edges) get much larger divisors, they're discarded more aggressively.
This is a deliberate design choice: human vision is more sensitive to tonal changes than fine texture. The asymmetry means:
- ●A clear blue sky compresses extremely well, mostly low-frequency content. Quality 60 might look indistinguishable from quality 95.
- ●A forest canopy or animal fur compresses poorly, dominated by high-frequency detail. Quality 80 might produce a file nearly as large as quality 90.
- ●Text and hard edges show ringing artifacts, the DCT cannot represent step changes cleanly, producing oscillations (Gibbs phenomenon) at quality below 85.
- ●The same quality setting produces wildly different file sizes on different images, which is why there's no formula that maps quality to file size without running the actual encoder.
The Non-Linear Quality-to-File-Size Relationship
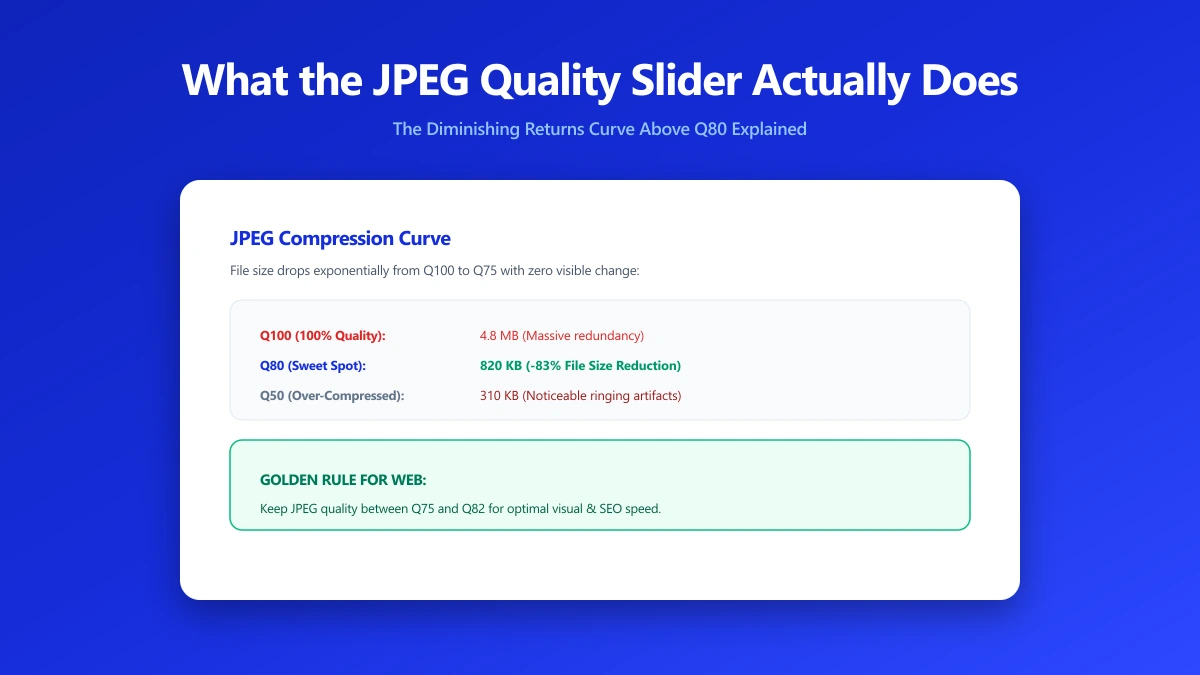
The relationship between quality and file size is highly non-linear, especially at the high end. Most of the file size savings are concentrated in the range from quality 100 to quality 75:
// Approximate file size relative to Q85 baseline (varies significantly by image):
// Q100 → 8–15× baseline  (minimal compression, for archives and re-edit sources)
// Q95  → 2.2× baseline   (near-lossless; print intermediates)
// Q90  → 1.4× baseline   (no visible improvement over Q85 at screen resolution)
// Q85  → 1.0× baseline   ← "baseline" in this table
// Q80  → 0.8× baseline   ← optimal web sweet spot; invisible quality difference
// Q75  → 0.65× baseline  ← slight loss under 200% zoom; good for thumbnails
// Q70  → 0.5× baseline   ← visible in smooth areas; strict bandwidth budgets only
// Q60  → 0.35× baseline  ← blocking and banding visible in sky, skin tones
// Q50 → 0.25× baseline ← standard JPEG table; clearly degraded photographs| Quality | File size (2MP photo) | Visual result | Use case |
|---|---|---|---|
| 100 | 3–8 MB | Mathematically minimal loss; imperceptible vs. Q95 | Archiving only, no practical benefit at screen size |
| 90–95 | 1–2 MB | Virtually identical to original | Print intermediates; files to be re-edited; client deliverables |
| 85 | 600–900 KB | Indistinguishable at normal viewing | Images that will be recompressed by third parties (social, CDNs) |
| 80 | 350–550 KB | Indistinguishable at screen resolution | Optimal for web, maximum quality savings, invisible loss |
| 75 | 250–400 KB | Barely detectable under 200% zoom | Thumbnails; space-constrained uses |
| 60–70 | 150–250 KB | Visible blocking in smooth areas | Only for strict size limits where visual quality is secondary |
| Below 50 | Under 150 KB | Clearly degraded | Avoid for any use where quality matters |
Why Quality 95 Is Overkill for Web
Going from quality 80 to quality 85 adds roughly 20% to file size for no visible improvement at screen resolution and normal viewing distances. Going from 85 to 95 roughly doubles the file size, for an improvement that's visible only when zooming into fine texture on a calibrated display.
At web display sizes (an image displayed at 800px wide on a 2× retina screen), the practical limit of discernible detail is around quality 75–80 for photographs. Above that threshold, you're storing data that cannot be perceived at that display size. The exception: images that will be recompressed by another system (social platforms, CDNs, or platform image pipelines). For those, using quality 85 gives the downstream encoder better source material to work from.
Progressive JPEG: Better Perceived Performance
A standard (baseline) JPEG loads from top to bottom: the first slice of image data paints the top of the image, and subsequent data fills in row by row. A progressive JPEG loads in multiple passes: the first pass shows a low-resolution preview of the entire image, subsequent passes add detail. This makes the image appear to load faster because viewers see the full composition before full quality is available.
Progressive JPEGs are also typically 10–15% smaller than baseline JPEGs at the same quality. Most modern JPEG encoders support progressive encoding; it's worth enabling for any large image that appears above the fold.
Practical Quality Settings
- ●Quality 75–80: The optimal range for web photographs. Invisible loss at screen resolution. 60–70% smaller than quality 95.
- ●Quality 85: For images that will be recompressed by third parties, social platforms, Shopify's CDN, any system that will re-encode on its end.
- ●Quality 90–95: Only for print intermediates, files that will be edited again, or professional client deliverables.
- ●Never quality 100 for web: Produces minimal compression at 8–15× the file size of quality 80. No perceptible quality benefit at screen resolution.
- ●For WebP: Quality 75 WebP ≈ JPEG quality 85 visually, at about 30–35% smaller file size. Don't apply JPEG quality intuitions directly to WebP.
Bottom Line
The JPEG quality slider controls how aggressively high-frequency detail is quantised. It is not a percentage of fidelity preserved. The practical implication: quality 80 is the correct default for web photographs, not because "80% of detail is preserved" but because at that quantisation level, the discarded high-frequency data is imperceptible at screen resolution and normal viewing distances. Quality 95 is roughly 2× the file size of quality 80 with no visible benefit on screen, and quality 75 saves another 20% with differences visible only on close inspection. The live size estimate in our image compressor shows this relationship directly as you drag the slider.
Frequently asked questions
Does JPEG quality 80 mean 80% of the original quality is preserved?
Why does quality 80 produce different file sizes on different images?
Is quality 95 significantly better than quality 85?
Why does quality 80 in Photoshop look different from quality 80 in another tool?
What is a progressive JPEG and should I use it?
Sources & references
This article was researched and written by Nikola, drawing on the following primary sources and documentation:
Ready to try it?
All tools run entirely in your browser, no uploads, no account required.
Compress Image